Inside of SAP Web Intelligence you can create a number of administrative area maps with boundaries right out of the box. Create the Map STEP 1: With the Webi Report…

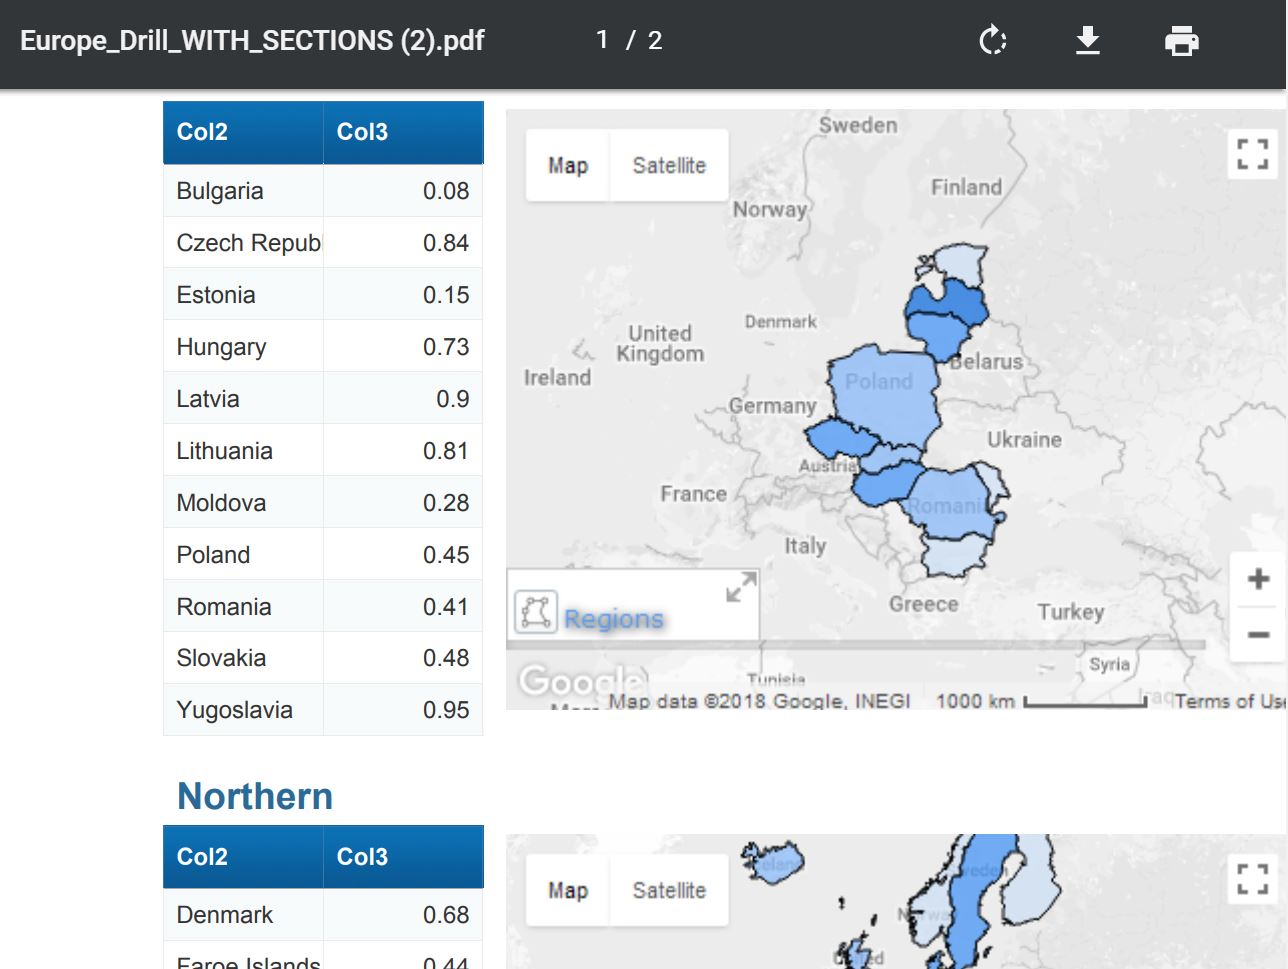
CMaps Analytics element for Webi provides printable mapping capabilities without any adjustments to your map or install. HOW DOES IT WORK? When you print, schedule, or export a map to…

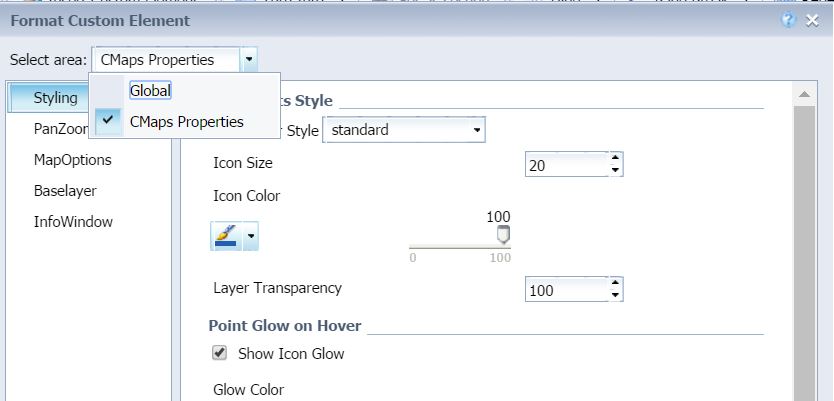
Inside CMaps Analytics Webi element you can modify visual and behavior properties that change the visual appearance and avaialble features. Styling Properties that modify the visual appearance of your maps…
SAP Dashboards (formerly Xcelsius) CMaps Plugin for SAP Dashboards SAP Dashboards Versions BI4.0, BI4.1, and BI4.2 SAP BusinessObjects Dashboards (v6.0.4 and higher SAP Crystal Dashboard Design (v6.0.4 and higher) SAP…
Copy and Configure Map Data from Excel STEP 1: Copy data from Excel or Google Sheets. This is a TSV (Tab Separated Values) STEP 2: Select copy/paste option STEP 3:…
In CMaps Analytics Designer, you can import .CMAP templates from your desktop, but there is a need for many applications to launch a template from a URL. Additionally, you can…
Creating a density map / heatmap with CMaps Analytics is supported as a standard visualization out of the box, and requires changing only 1 property. Once you have added a…
With CMaps Analytics points map, you have lots of flexibility to create different visualization experiences from within Webi by clicking and changing properties. In this tutorial we will show you…

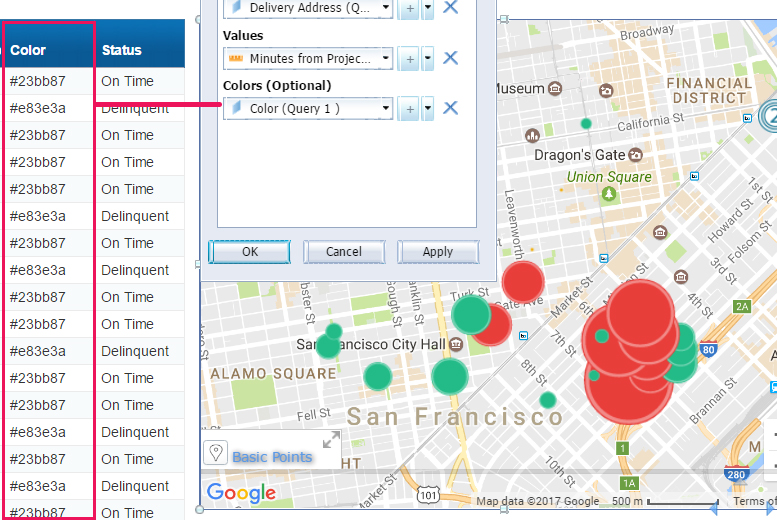
Using Color Property in Webi The color property in CMaps Analytics will accept hex codes for color, allowing you to control each point or region color using formulas. In this…

