CMaps Analytics for SAP Dashboards (formerly GMaps Plugin), we have opened the door for new kinds of geo-analytics that use geography not only as a way to constrain but also visualize information in new ways for BI consumers.
A few weeks ago, we set off to create our own grid analytics. Thanks to CMaps Plugin new reverse geocode, current location, and polygon selection we can create interesting analytics like this within minutes.
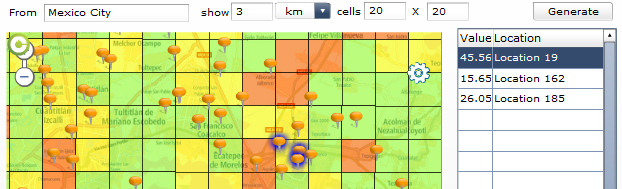 |
| Grid Analytic with CMaps Plugin for SAP BusinessObjects Dashboards. |
In this example, we specify that we want 3km cells starting from Mexico City, with a 20×20 gid. With a 60 square km area covered, we can now visualize alerts and better yet, dynamically select specific points within each grid cell using the new CMaps Plugin polygon selector option.
The grid rendering process is completed via a simple service that accepts inputs from SAP Dashboards and then returns the appropriate grid data to CMaps Plugin. This grid service is available upon request today, and will soon be available as an optional service for CMaps Analytics customers.
Contact Centigon Solutions sales for more information.
]]>