CMaps Analytics Suite today.
This week we took the opportunity to re-create an existing Tableau demo, and in this article highlight some of the reasons why customers can look to CMaps Analytics for a superior mapping experience for dashboards, BI Apps, and other custom HTML5 solutions.
The CMaps Analytics Result
Feature Similarities
Tableau has recently added more features to expand its flexibility and power through OpenStreetMaps, which is their base layer foundation for its mapping capabilities. With their own hosted infrastructure, I presume the Tableau mapping experience will only get better with time, as we know first-hand the benefits of using open source data to deliver Location Intelligence. Here are the standard features you can expect at your disposal in Tableau Maps and CMaps Analytics.
- Support for multiple layer types (Points, Shapes (Shapefiles)
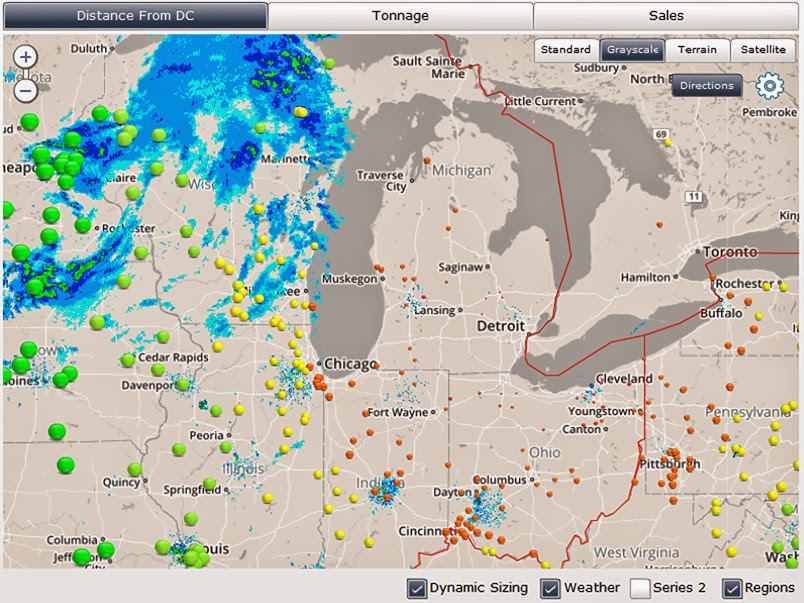
- WMS support for GIS data driven overlays like weather (shown above)
- Data driven icon sizing and coloring
- Global maps coverage
- Geocoding
- Filtering and drilling
CMaps Analytics Advantage
- Multi-layer maps: The beauty of location intelligence is the ability to blend un-like data visually using geography as the only common dimension. A fundamental flaw in most analytics mapping solutions is the inability to layer multiple layers of data, or borrowing a GIS approach for maps layers. Rather than treating each layer is an information silo, CMaps Analytics Designer now provides features that establish relationships between map layers for drilling and filtering.
- Drilling: CMaps Analytics is designed to enable drilling across multiple geographies using completely different data sources/queries and visualization types. For example region, to state, to facility is a supported workflow that would be near impossible with Tableau today.
- Additional native visualizations: Hub-spoke diagrams, polylines, text, density maps
- Custom Territory Visualization and Design: CMaps Plugin for Quantum GIS grants non-GIS professionals to create custom territories from scratch before incorporating them into CMaps Analytics
- Powerful, commercial grade geocoding options: Currently powered by TomTom (flash based maps and batch geocoding) or Google Maps (HTML5 based maps).
- New CMaps Analytics Cloud Services: Starting with our new drive time/distance visualizations, we have a new wave of services that enhance the power of location intelligence without additional investment in infrastructure or specialized skills.
- HTML5, Embedded Location Analytics and Javascript API: If you don’t have enough control through our point and click designer and over 100 properties, you have a Javascript API to configure any aspect of your map to create the exact user experience your business users desire.
Do you need a powerful geographic visualization solution for your business app or product?
Now, with CMaps Analytics designer, you can embed our location intelligence designer experience right inside of your own analytics solution.Learn More and sign up for a test drive account. ]]>