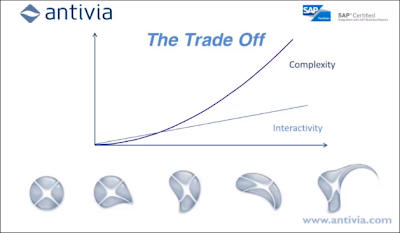
Tech-Tuesday? You missed out on a very compelling presentation from Antivia’s Donald MacCormick on “Why dashboard creation gets complicated and how OLAP solves the problem” SIGN UP TO BECOME A CENTIGON GURU TO WATCH THE RECORDING ON-DEMAND In Donald’s presentation, he talked about the trade-off that exists with dashboard development in SAP BusinessObjects Dashboards between interactivity and complexity. In other words, as the levels of drilldown and interactivity increase, the complexity increases exponentially (where many dashboard projects go wrong). Frankly, this shouldn’t be the case as users want to drill, slice and dice through data as part of a dashboard experience.
That is where the power of OLAP comes in, and where a platform like Antivia XWIS makes all of the difference. It stores a micro cube in memory so users can slice and dice within the dashboard and developers can create this functionality without increasing the complexity of the dashboard. Donald whipped up a live demonstration in 5 minutes and created a dashboard that would typically take 15 queries and days of development, troubleshooting, and documentation.
We can’t wait to have Donald back for another Tech-Tuesday!


