lottery pick analysis dashboard. You can view not only what players were drafted by NBA teams, but also what colleges they came from. So weather you are a NBA or NCAA fan, this dashboard is for you.
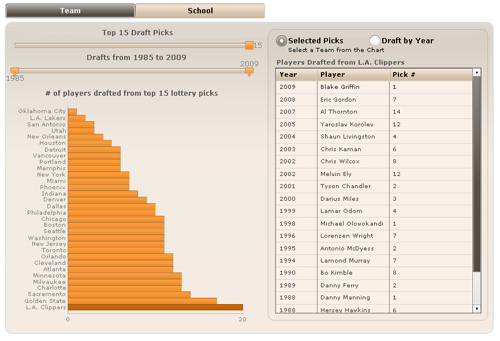
 Filtered Summary Used to dynamically count the number of players drafted to NBA teams, Filtered Summary provides a critical calculation layer to drive the analysis as you increase or decrease the number of years or draft numbers. Rather than relying on cumbersome, performance hindering logic, Filtered Summary continuously evaluates every player drafted from 1985 and then generates a summary table that is visualized in a bar chart. More Information

Dynamic Sort When Filtered Summary generates a dynamic count for each NBA team or College for where players are drafted, dynamic sort will automatically re-sort the data in place so the graph can visually represent the number of players in a descending order. With 2 simple properties, you can enable sorting and ranking with no impact to performance and no Excel logic. More Information
 Background Builder To create a professional looking user interface, Background Builder was utilized to enclose all components into a single dashboard. With un-intrusive gradients and textures background builder can create a wide range of graphical styles. In the NBA dashboard background builder was combined with a brown color scheme aligned to basketball. With a few clicks of the mouse, you can easily re-configure background builder to a less flashy color scheme. More Information
Now we have to wait and see if there is an NBA season to enjoy next year with a lockout looming.]]>