GMaps Plugin or GMaps Mobile.
While our products currently don’t allow for free form drawing, there are some great utilities on the web that make this extremely easy.
Our favorite is here:
http://www.birdtheme.org/useful/v3tool.html
This web utility provides everything you need to draw polylines and polygons. I whipped up a quick example so you can see what it looks like to draw around the stadium in San Diego. You can copy the latitude,longitude points and paste them right into Xcelsius

1. Make sure the first drop down is set to “Polygon” not “Polyline”. A polygon is an enclosed shape that will be clickable inside of Xcelsius. A polyline will be a line like a power or water line. 2. To center the map on the location you want use the search box. 3. You will need only the latitude,longitude data highlighted in the screenshot. The rest of the KML is not required by GMaps Plugin.
Entering the data into SAP BusinessObjects Dashboards (Xcelsius)
When you paste the data into SAP BusinessObjects Dashboards you will first need to clear the elevation data. As you notice there are actually 3 values “Latitude,Longitude,Elevation”. GMaps Plugin does not require or support elevation data so we need to strip it. In the template we mocked up a simple Excel formula routine to strip the elevation. Connecting the data to GMaps Plugin
The last part is just a few steps:
- Drag and drop GMaps Plugin onto the canvas and open the property sheet.
- Chose polygon and click on the Shape Data radio button and then click on the edit icon
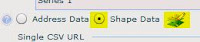
- Select the “Spreadsheet Data” and make sure “Polygon” is selected. This will tell GMaps Plugin to use spreadsheet data to define the polygon shape.

- Bind the Regions/Address property to the modified data. Unfortunately the data comes back from the tool as longitude,latitude so we have to flip it. To do so we created some Excel logic to do the work for us that you can reuse in the template XLF.
- Because we created 2 shapes in our example, we bind in the property sheet 2 labels, 2 values, and 2 alert targets.
- The final tweak was to open the the Appearance tab and you can set the polygon transparency and even switched the outline color to white.

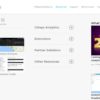
CLICK THE IMAGE TO SEE IT IN ACTION
DOWNLOAD THE FREE TEMPLATE
That’s it!.. 10 minutes of work and we are creating custom polygons and wiring up with alerts in our dashboard.