[su_button url="http://cmapsanalytics.com/webi.html" target="blank" style="flat" background="#3e85d8" size="7" radius="0" icon="icon: lock"]Learn More and Sign Up[/su_button]
Moving forward from Basic Geomaps
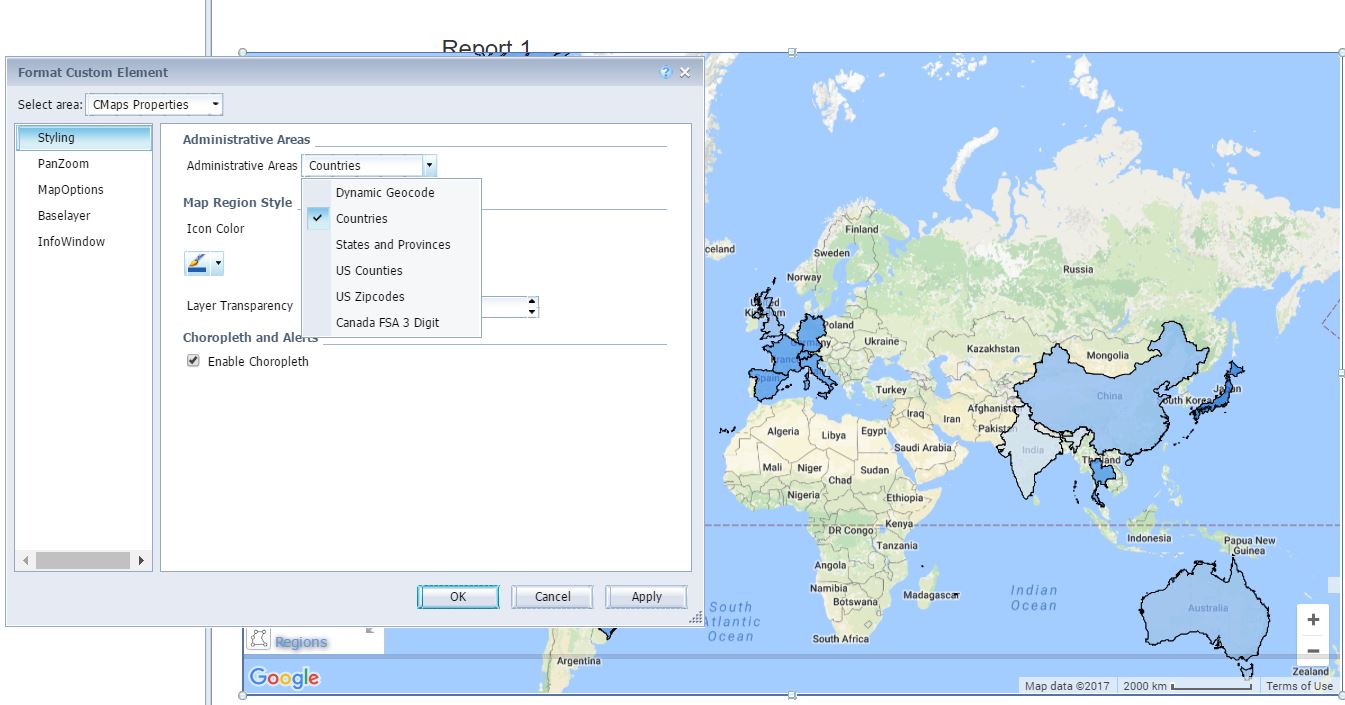
If you don’t consider your maps to be a strength for your BI platform, you are behind the curve. Using CMaps Analytics JS API, we can transform any platform. In this example we have standard geo maps which provide a single dimension and requires manual data cleansing and mapping. CMAPS ANALYTICS: On the other hand CMaps Analytics cloud geocoder automatically handles this process with multiple aliases and localized geography names and no manual work involved. Fine grained control over formatting, pop-up windows, color, and basic spatial analysis built-in is one of a few capabilities that should come out of the box but are unfortunately unavailable. With more data down to zip code level, analysis widgets, and a growing list of data viz layers and third party integrations, CMaps Analytics is jam packed with functionality, which we are carefully introducing.