Create your first Google Map in Webi
BEFORE YOU START
INSTALL THE EXTENSION:Â CMaps Plugin requires an extension to be installed on your BusinessObjects Enterprise Application server. View Install Directions | Supported Versions
IMPORTANT NOTE: Use of the HTML5 Viewer. Java viewer is not supported with CMaps Analytics. Though the Java and Rich Client versions of Webi are supported by SAP BusinessObjects, it does require you to connect  to the BusinessObjects repository via IP address, instead of the domain. More Troubleshooting Tips

Display CMaps Analytics Map in a Report
Opening the CMaps Webi View
Prior to using CMaps Analytics Webi Extension, you need to install it on your BusinessObjects server, and enable it inside of the BusinessObjects CMC. View Install Instructions
Step 1.
While in Reading mode, select the CMaps Analytics Extension in the left pane. You will notice by default, the extension will indicate that there is no map content available for this report. Why? You need to first go into Webi Design Mode, enable the map component and then push data to the map from your report part(s).
Step 2.
Toggle the Webi report into design mode, if you are not already. This is where you will configure CMaps Analytics designer.
![]()
IMPORTANT NOTE: There is a minor issue inside of Webi SDK which will require you in certain cases to save your report and re-open it to proceed. In newer versions of the extension we it will warn and instruct the end user.
Connect a Webi Report Part to the Map
In Design Mode, with the Map icon selected (step 1 & 2), you will now see a map property sheet:
Step 3
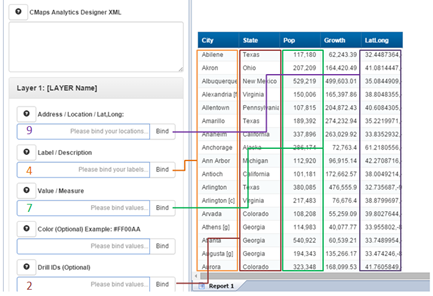
Identify the fields (columns) that you will bind to the map using the map requirements below:
MAP DATAÂ REQUIREMENTS:
Your Webi report part will need to contain specific fields / data to effectively visualize the information on a map. There are 3 required fields
Locations: Locations can be represented as a  comma separated latitude,longitude, address, or any other geographic locations that you would like to display as pins, regions, or other layer types.
If your report has Latitude and Longitude in different fields, you can use a custom variable to concatenate them.
Labels: Labels are displayed on the map when you select a pin or region.
Values: Values are numeric measures, utilized for the analysis and visualization options available in CMaps Analytics. You will bind this to a measure column.
 WEBIÂ REPORT FORMATTINGÂ REQUIREMENTS:
1. Your Webi report must be a vertical table. Horizontal and Cross Tabs are NOT supported.
2. Your Webi report must NOT use hidden fields.
Step 4. For each property, bind a column by first clicking “Bind” and then click anywhere inside of a vertical table column you want to bind. CMaps Analytics will automatically bind to the column ID and display it.
IMPORTANT NOTE: If you click bind but do NOT see the column number, you could be experiencing a minor issue inside of Webi SDK which will require you in certain cases to save your report and re-open it to proceed. In newer versions of the extension we it will warn and instruct the end user.
IMPORTANT NOTE: When binding, do NOT click on the header. Please click anywhere within the vertical table column you want to bind.
IMPORTANT NOTE: Do NOT bind columns from 2 different talbes into the same map layers. Each map layer can only read columns from the same webi table.
Step 5.
Click on the Map View tab to preview the map.
Step 6.
Click on the Desgin tab and change feel free to explore the different template views in the dropdown. Then view return to Map View.
Step 7.
That’s it!
Ready to build something more sophisticated?
1. Learned how to use CMaps Analytics Designer and Create your First Map ViewÂ
2. Learn how to import a map from CMaps Analytics Designer into WebiÂ


