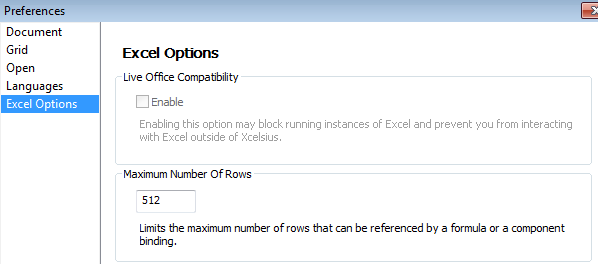
By default, SAP Dashboards Xcelsius / Excel has a row limit of 512 rows that are readable from any data block. In plain English, that means that if you have a Query returning 1500 rows of data, only 512 of them are going to be read.
You can change this setting at the menu command: File >>Preferences>>Excel Options (left side of menu) and entering a new value for the row limit.
Do not inflate this number too high, as larger blocks slow the Dashboard load times and decrease performance.Use just what you need for this setting. Theoretically, there isnt a limit on how high you can go, but anything over 2000 is going to be unpredictable. This point is up for argument, however. Yet, many might agree that Xcelsius is not a good tool for analyzing 30,000 rows of data at the same time. Remember that your data is getting converted in a SWF by Xcelsius, the less code, the better. Reduce your rows with better pre-aggregated queries.


