Color
By default, GMaps Plugin provides control over all icons within a series using a color picker. If you decide to implement alert icons or need to control each icon’s color independently, you can utilize the dynamic color property, located on the Appearance Tab, next to the color picker.
Bindable Colors
Bindable colors are defined using hexadecimal color coding prefix, which is standard for web design. The following are example hexadecimal codes that can be utilized to dynamically change icon color.
 Accepted Color Formats
Red= 0XDD0000 or DD0000 or #DD0000
Yellow 0XEEEE44 or EEEE44 or #EEEE44
Green 0X00BB55 or 00BB55 or #00BB55
Binding Colors for icons, polylines, and shapes:Â
Bindable colors are defined per icon, shape, or line. You will define a data range that contains the same number of cells as labels or values.
Mouse Enabled
Enable or disable any series from being selected during runtime. This option allows any series to exist as a visual without interactivity
Transparency
Control the transparency of each series within the map independently. Polygons and heat maps are generally viewed at 93% transparency so the map times are still readable.
Sample alert logic if A1 is the value
=IF(A1>20.01,�0X00BB55�,IF(AND(
A1<20,A1>15),�0XEEEE446�,�0X00BB55�)
)
NOTE: Alerts provide control over color and icon style based on values
Learn More About Alerts
Color Picker
[ezcol_3quarter]Icon Styles
GMaps Plugin provides a range of icon styles to choose from base on your business requirements. These highly compressed graphics ensure maximum performance when rendering larger volumes of data.
Marker Series Style
Choose from over 20 popular marker icons styles for each individual series. Styles are only available when you choose the address/latlong option on the General Tab. Icon styles can be
Heat maps /Density Maps

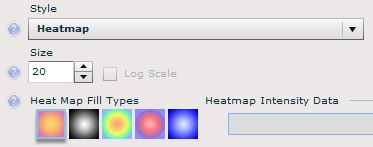
Heat map icon type is listed inside of the icon style property. This visualization displays density of latitude and longitude points on a map. As the number of data points increase in a specific area, the color intensity will increase. The heat map icon style currently includes pre-defined fill types that can be layered across multiple series. Like icons, heat maps can use dynamic icon sizing.
Heat map/Density Map Style
Heat map data points, can contain an additional measure, heat map intensity data, to control the color intensity of each data point. Like labels and values, binding heat map intensity data will require one cell per data point.
Marker Key Property
Marker Key Property allows you to define 1 key per data point within a series. A key can contain a specific marker key to display a standard GMaps Plugin icon, or a URL to display a custom icon. View the Standard Key table for a complete list of available icons.
Mobile Marker Keys:
For a list of additional mobile-enabled marker keys, visit the mobile properties tutorial.
Other Ways to Change Marker Styles
Another way to dynamically change icons is through the Alerts Tab. If you enable alerts for a series, icon keys are over-written. View Alerts Tab for more information.
[/ezcol_3quarter] [ezcol_1quarter_end]| Standard Key | |||||||||||||||||||||||||||||||||||||||||||||||||||||||||||||||||||
|
|
Custom Icons
Custom icons are defined using the Icon Key property.
For each data point you will define a URL to a SWF, JPG, PNG (supports transparency), or GIF. CMaps Plugin and GMaps Plugin will NOT embed any custom images in the SWF when compiled. Custom URLs can be mixed with standard CMaps Plugin and GMaps Plugin icon keys.
IMPORTANT NOTE:Â To ensure consistency, CMaps Plugin and GMaps Plugin makes custom icon requests in lower case regardless how you input your values. This lowercase transformation is also applied to custom icon URLs. If your custom icon file names include capital letters, you may need to re-name your files for compatibility.
Example of a working URL
http://gmapsplugin.net/testing/test.png
Example of a non-working URL
http://gmapsplugin.net/testing/Test.png


