See the Code – See it Full Page – See Details Validate/Test various cluster distance options This Pen uses: HTML, CSS, JavaScript, and See the Pen


See the Code – See it Full Page – See Details Validate/Test various cluster distance options This Pen uses: HTML, CSS, JavaScript, and See the Pen
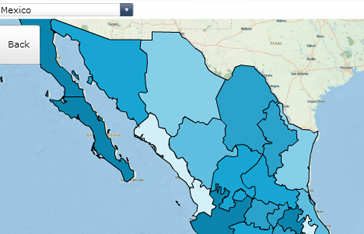
Multi-Layer Map Selection with SAP Dashboards DOWNLOAD CMaps Plugin Template
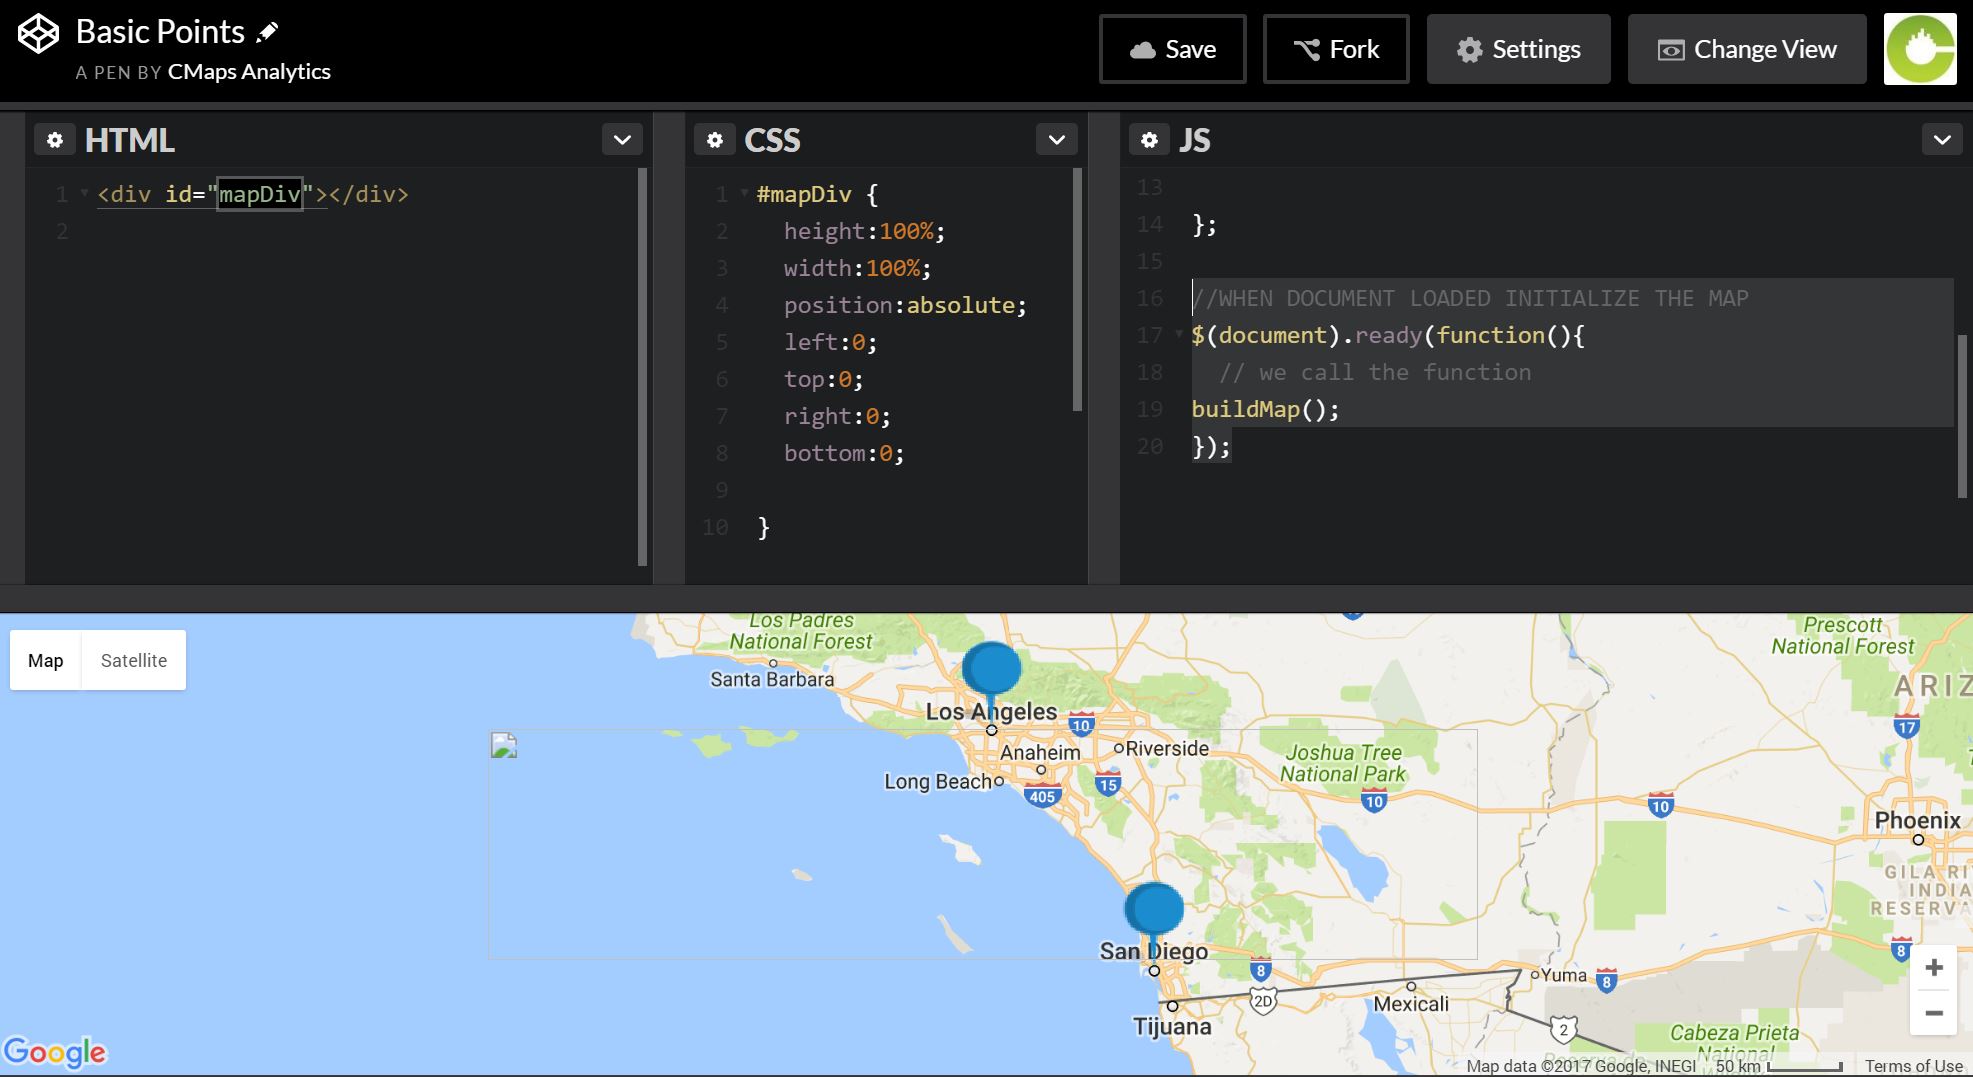
New dynamic sizing properties allow you to control the width, height and X/Y position of the map at all times. This particular example uses a simple push button to modify…
Alerts are a powerful way to utilize business data to control the color and orientation of your dashboard. CMaps Analytics allows developers to not only change the color, but also…
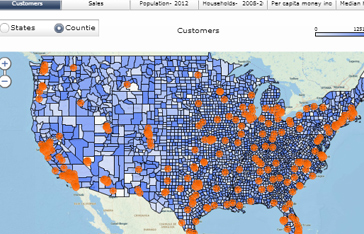
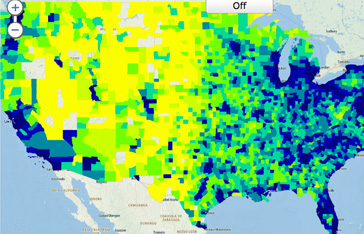
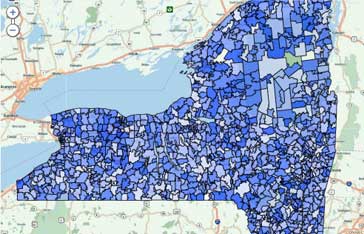
Use multiple shapefile layers and create interactivity, allowing a business user to drill from state to county level metrics. DOWNLOAD- Login Required
This template provides you with a complete dashboard, where you can plug and play your dashboard data. DOWNLOAD DASHBOARD TEMPLATE- Login Required DOWNLOAD DASHBOARD ZIP SHAPEFILES (READ-ONLY) Login Required
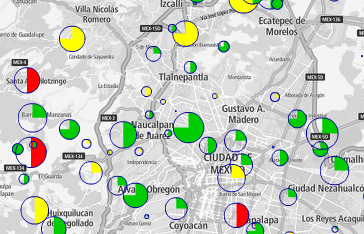
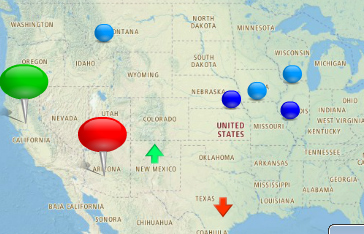
Custom icons open up the doors for many different visualizations. In this example, we use 3 different measures to drive dynamic icon size, color, and fill. To keep the visualization…
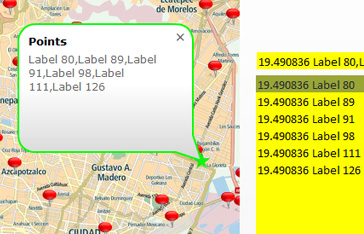
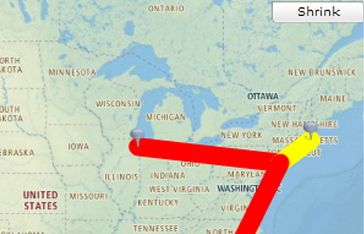
When there are multiple points at a single location an you need to not only flag but also select those locations, you have 2 options. First, you have a built-in…
A highly common feature, CMaps Analytics coupled with shapefiles can enable your users to drill from country, down to state, and even deeper using your data. DOWNLOAD- Login Required PREMIUM…